In the photovoltaic industry, the Performance Ratio (PR) is a key metric for assessing system effectiveness, directly impacting the investment and operational value of solar power plants. Recently, many customers have inquired about photovoltaic system efficiency, seeking to better understand the concept of PR and how to calculate it. Many assume that the degradation efficiency of modules or the conversion efficiency of inverters represent the overall system efficiency, but this is not the case.
As a professional photovoltaic product supplier, Maysun Solar aims to provide a detailed explanation from the following perspectives: the definition and calculation of PR, the key factors influencing PR, and effective methods for improving PR. Through this introduction, we hope to help customers gain a clearer understanding of photovoltaic system efficiency and provide scientific support for investment and management decisions in solar projects.
Table of Contents
What is System Efficiency? How to Calculate It?
The power generation of a photovoltaic power plant is determined by three key factors:
- Installed Capacity: The total capacity of solar panels within the plant, typically measured in kilowatts (kW).
- Peak Sun Hours: The total number of hours per year during which the plant can generate electricity under maximum sunlight, depending on local solar radiation conditions.
- System Efficiency (Performance Ratio, PR): The overall efficiency of the plant in converting solar energy into electrical energy. This is a critical indicator for evaluating the performance of a photovoltaic power plant.
Once the location and scale of a photovoltaic power plant are determined, the installed capacity and peak sun hours are generally fixed. To increase the power generation, improvements must be made by enhancing system efficiency.
The system efficiency of a photovoltaic power plant (Performance Ratio, PR) is a key indicator for assessing the plant’s ability to convert solar energy into electrical energy. It not only includes the conversion efficiency of the solar panels but also takes into account the overall power losses in the entire photovoltaic system. Understanding system efficiency helps assess the gap between actual and theoretical power generation. The higher the system efficiency, the better the power generation performance of the photovoltaic power plant.
Typically, the system efficiency of a photovoltaic power plant can be calculated using the following formula:
System Efficiency (%) = Actual Power Generation / Theoretical Power Generation × 100%
- Actual Power Generation: This refers to the actual amount of electrical energy generated by the photovoltaic power plant during its operation, typically recorded in real-time by the monitoring system.
- Theoretical Power Generation: This is the expected amount of power generation calculated based on local solar radiation conditions, system capacity, and ideal conversion efficiency.
The theoretical power generation of a photovoltaic power plant can be calculated using the following formula:
Theoretical Power Generation = Total Solar Radiation × Solar Panel Conversion Efficiency × Solar Panel Area × Time
IEC 61724 is the international standard for photovoltaic power plant performance monitoring, which provides guidelines for monitoring, evaluating, and reporting the performance of photovoltaic systems. It is applicable to photovoltaic plants of all sizes, ensuring data accuracy and comparability.
In this standard, the system efficiency (PR) calculation formula for a photovoltaic power plant is as follows:

- PRT: The average system efficiency of the photovoltaic power plant during the time period T.
- ET: The amount of electricity fed into the grid from the photovoltaic plant during the specified time period.
- Pe: The nominal capacity of the photovoltaic system’s components.
- hT: The peak sun hours on the array surface during the specified time period.
*It is important to note that the actual power generation and system efficiency of a photovoltaic power plant are influenced by various factors, such as weather, temperature, sunlight, and inverter losses. Therefore, the actual operational efficiency may fluctuate.
Example of Calculating PR with Simulated Measurement Data:
Let’s take the example of calculating the annual PR (Performance Ratio). Suppose the total annual radiation received by the photovoltaic array is 1600 kWh/㎡, meaning the array receives a total annual radiation time of 1600 hours. If the electricity meter records an annual power generation of 1300 kWh/kW, the annual PR can be calculated as follows:

Steps and Considerations for Measuring PR:
To measure the PR value of a photovoltaic power plant, follow these general steps:
Install Monitoring Equipment: Install monitoring devices such as solar irradiance meters, thermometers, and ammeters in the power plant to monitor output power, environmental factors, and meteorological conditions in real time.
Data Collection: Over a period of time, collect data on the plant’s output power, solar irradiance per unit area, module temperature, and tilt angle, among other parameters.
Calculate Theoretical Power Generation: Based on the technical parameters of the photovoltaic modules, local solar irradiance, and environmental temperature, calculate the total expected power generation under standard test conditions (STC).
Calculate Actual Power Generation: Use the real-time monitoring data to calculate the actual power generated by the system over the specified time period.
Calculate PR Value: Compare the actual power generation with the theoretical power generation to calculate the system’s PR value.

Key Considerations When Testing PR Values:
Choose Typical Sunny Periods
To ensure the reliability of the test results, it is recommended to select typical sunny periods for testing. This avoids interference from weather changes, such as cloudy or rainy conditions, which could distort the test results.
Ensure Accuracy of Measurement Equipment
During the testing process, ensure that all measurement devices, such as irradiance meters, thermometers, and other monitoring equipment, are calibrated and accurate. This is critical to ensure the precision and credibility of the test data.
Conduct Repeated Tests to Ensure Accuracy
Tests should be repeated multiple times to ensure the reliability and consistency of the results. Multiple measurements help confirm that the results are accurate and that any potential anomalies are identified and accounted for.
Ensure Consistency of Testing Conditions
For consistent test data, it is important to maintain stable conditions throughout the testing period. This includes consistent testing times, the settings of testing equipment, and the environmental conditions during each test. Maintaining uniformity in these factors ensures that the data collected is comparable and accurate.
What Affects System Efficiency?
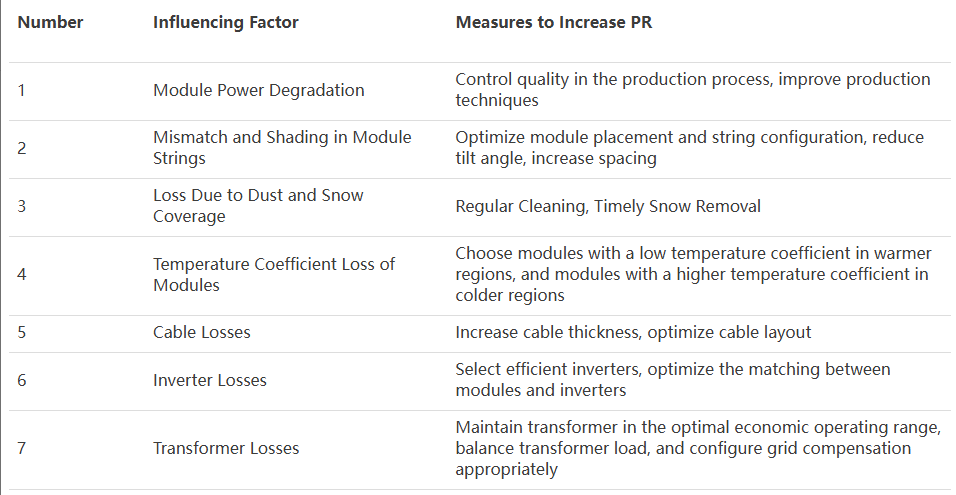
Component Power Degradation (2-3% in the first year, then 0.5% annually)
In photovoltaic systems, power degradation of the components is a significant factor affecting overall system efficiency, but it is not the only determining factor. Many customers mistakenly believe that the degradation of the components directly determines the system’s overall efficiency. However, system efficiency is influenced by multiple factors.
Component degradation during normal operation is usually within an acceptable range. Typically, monocrystalline silicon solar panels experience a 2% to 3% power degradation in the first year, and thereafter, the annual degradation remains around 0.5%. However, system efficiency also depends on other factors, such as inverter efficiency, cable losses, temperature effects, dust, and shading. Even with reasonable degradation control, the overall efficiency of the system can still be impacted by these other factors.
For more information on component degradation, you can refer to our blog: Solar Panel Degradation.
Component Mismatch and Shading (Impact of around 3%)
When solar cells are connected in series or parallel, their electrical performance may differ, resulting in an overall output power that is typically less than the sum of the individual cell outputs. This phenomenon is called mismatch. In photovoltaic power plants, the primary cause of component mismatch is not the components themselves, but rather shading, particularly from surrounding buildings, trees, or other fixed obstructions.
For rooftop installations with less than ideal positioning, mismatch in the series or array configuration can result in an efficiency loss of around 3%.
Dust, Snow, and Obstruction Losses (Impact Range: 4.0% – 5.4%)
External environmental factors such as dust, snow, or other obstructions can block direct sunlight from reaching the panels, reducing their power generation ability. Dust and snow are particularly problematic in some regions and typically cause 4.0% to 5.4% efficiency losses. Methods for cleaning dust and snow can be found in this article: Cleaning Solar Panels.

Module Temperature Coefficient Losses (Impact of around 4%)
The temperature coefficient (as discussed in our blog: Temperature Coefficients of Solar Panels) is a key concept listed in the specifications of each solar module. For example, a module with an open-circuit voltage temperature coefficient of -0.33%/°C means that for every 1°C increase in temperature, the open-circuit voltage will drop by 0.33%. This effect is more pronounced in regions with significant temperature variations between summer and winter. Typically, temperature coefficient losses result in a 4% reduction in the PR value.
Line Losses (Impact of around 2%)
Line losses can be divided into DC line losses and AC line losses. The impact of line losses on system efficiency is typically around 2%. DC line losses occur during the transmission of DC current from the panels to the inverter, typically around 2%. AC line losses happen during the transmission of AC current from the inverter to the distribution system, influenced by cable length and current load.
Inverter Losses (Impact of around 3%)
The inverter (as discussed in our article: Photovoltaic Inverters: A Key Component) converts the DC power generated by solar panels into AC power and directly impacts system efficiency (PR). The losses in the inverter can be split into two parts: the inherent energy losses of the inverter itself, and losses due to input power exceeding the inverter’s rated capacity or working voltage. In total, the inverter can contribute to an efficiency loss of about 3%.
Transformer Efficiency Losses (Impact of around 2%)
The transformer’s role is to adjust the voltage to a level suitable for grid connection. However, transformers also bring energy losses, including the transformer’s inherent energy loss and losses that occur during nighttime idle periods or voltage stepping. These losses can cause a decrease in system efficiency (PR) by about 2%.
MPPT Efficiency Losses (Impact of around 1%)
Maximum Power Point Tracking (MPPT) is a key technology in photovoltaic systems used to maximize power output. Modern MPPT controllers are typically 99% efficient, but environmental changes and equipment performance can still result in a 1% loss in efficiency.
Overall Efficiency Chain (~78%)
Considering all of the factors mentioned above, the comprehensive energy efficiency chain of a photovoltaic system is typically around 78%. This means that, while photovoltaic systems have high energy conversion efficiency under ideal conditions, various losses during actual operation (such as shading, temperature changes, and inverter inefficiency) will affect the final energy output.
What PR Value is Considered Standard?
1.PR Value Under Ideal Conditions
Under theoretical ideal conditions (no shading, no temperature losses, no component degradation, etc.), the PR value can approach 90% to 95%. However, in practice, it is almost impossible for a photovoltaic system to achieve this range due to various environmental factors and system losses.
2.PR Value Ranges for Actual Projects
- Ground-mounted Solar Power Plants:Typically, the PR value ranges from 80% to 90%. Highly efficient solar power plants under optimal conditions may approach 90%.
- Rooftop Solar Power Plants:Due to factors such as rooftop shading, angle restrictions, and limited space, the PR value usually falls between 75% and 85%.
- Agricultural or Floating Solar (Special Environments):Due to varying sunlight and temperature conditions, the PR value for agricultural or floating solar plants may range from 70% to 85%.
3.Regional Differences in PR Values
- High Radiation Areas(e.g., Middle East and parts of Australia): PR values may be higher than average, typically ranging from 85% to 90%.
- Moderate Radiation Areas(e.g., Southern Europe): PR values are typically between 80% and 85%.
- Low Radiation Areas(e.g., Northern Europe): Due to climatic conditions, the PR value might range from 75% to 80%.
4.IEC 61724 Standard for PR Values
IEC 61724 provides guidelines for measuring PR values but does not strictly define what constitutes a “qualified” PR value. Generally, an industry-standard PR value above 80% is considered efficient, while a PR value below 70% may indicate the need for maintenance or optimization.
Methods for Improving PR

Innovative and Flexible Methods to Improve PV System Efficiency (PR)
In addition to the commonly mentioned measures, there are also innovative and flexible methods that can help further improve the Performance Ratio (PR) of photovoltaic power plants. Customers can refer to the efficiency formula:
PRT = ET / (Pe * hT)
to flexibly apply it to different scenarios.
For example, installing manually adjustable mounting brackets is a simple yet effective way to enhance system performance. These adjustable brackets can be set to two different angles for winter and summer, allowing the system to adapt to varying solar radiation angles throughout the year. This maximizes the exposure of solar panels to sunlight, increasing both the energy output and system efficiency, which in turn improves the PR value.
Furthermore, the application of smart operation and maintenance (O&M) systems can significantly optimize PV plant efficiency. These intelligent analysis systems are capable of real-time monitoring and analyzing the plant’s status, accurately identifying faults and addressing them promptly. Such precise fault diagnostics and quick responses can minimize downtime, enhancing the overall system efficiency and ensuring long-term stable energy production, which further boosts the PR value.
Conclusion
Through the introduction of the above aspects, we hope you now have a clearer understanding of the system efficiency (PR) of photovoltaic power plants. In practice, is a higher PR always better? In fact, the optimal PR value needs to be considered in conjunction with factors like economic viability, geographical environment, and specific use cases. It’s important to strike a balance among these factors when making decisions about system design and optimization.
We hope this article has provided valuable insights, and if you have any thoughts or questions, feel free to leave a comment below. Let’s discuss and share our ideas!
Since 2008, Maysun Solar has been dedicated to producing high-quality photovoltaic modules that contribute to combating climate change. Our advanced technology in IBC, HJT, TOPCon, and balcony solar panels ensures exceptional performance and reliability, capable of withstanding harsh weather conditions for long-term operation. We have established offices and warehouses in multiple countries and built lasting partnerships with top installers to provide comprehensive support. For the latest quotes or any inquiries related to photovoltaics, feel free to reach out to us—we’re here to help!

Empowering Factories with Solar Energy A Strategic Tool for Controlling Production Electricity Costs
Commercial and industrial solar is becoming a key solution for factories to reduce electricity costs and hedge against price fluctuations. This article systematically analyzes its deployment models, cost advantages, and sustainable value pathways.

How Businesses Can Offset Carbon Taxes with Solar Power
This article analyzes the latest carbon tax policies and photovoltaic deduction strategies, helping European businesses legally reduce taxes, increase profits through solar investment, and achieve a win-win situation for both economy and environment.

Forecast and Response: Seizing the Next Decade’s Growth Dividend in Europe’s Commercial and Industrial Photovoltaics Market
Maysun Solar analyzes the growth trends of commercial and industrial photovoltaics in Europe over the next ten years, from policies and ESG to technological innovation, helping companies seize the initiative in the energy transition.

How to Calculate Solar System ROI and Optimize Long-Term Returns?
Solar power is becoming a key solution for businesses to reduce costs and improve efficiency. Accurately calculating ROI and optimizing long-term returns are essential to maximizing investment value.

Will Agrivoltaics Affect Crop Growth?
Agrivoltaics combines solar energy and agriculture to reduce up to 700 tons of CO₂ per MW, improve water use, and boost crop growth for sustainable farming.

6.5 Billion Loss Hits Photovoltaics: Reshaping or Elimination?
In 2025, the photovoltaic market may see a turnaround as some companies take early action. A €6.5 billion loss is driving businesses to explore new growth areas like energy storage and hydrogen. Which giants will break through? Industry transformation is accelerating!


It’s going to be end of mine day, except before ending I
am reading this enormous post to increase my knowledge.
Thank you for your kind words! We’re glad you found our post helpful and informative. If you have any questions or would like to share your thoughts on the topic, feel free to comment here. We’re always happy to engage with our readers and provide more insights!